White/Europeans Compared Against All Racialized Groups
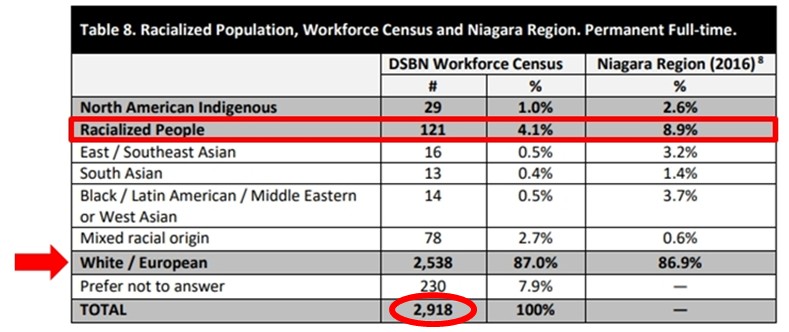
5.1 Let’s now concentrate on the FULL TIME census workforce sector of the DSBN chart below.
5.2 Of the 2,918 Full-Time DSBN Census Workers that did choose to indicate how they identify in the census. Only a small amount of 121 individuals identified as being a member of the racialized population.
5.3 This is a stark contrast to the White/Europeans who are composed of just 1 racialized group. The Racialized Persons category includes a total of 8 different racialized groups but still only accounts for a very low 4.1% of the entire DSBN racialized census workforce.
5.4 Reviewing the chart as a whole,
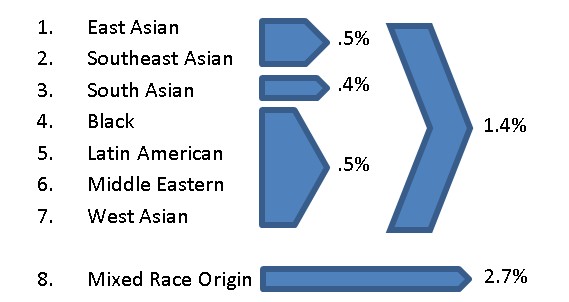
5.5 There is a difference of 2.2% more mixed race employees than the combined East and Southeast Asians.
5.6 There is a difference of 2.3% more mixed race than South Asians.
5.7 There is a difference of 2.2% more mixed race than Blacks, Latin Americans, Middle Eastern and West Asians all combined.
5.8 And there is an over difference of 1.3% more mixed race than all 7 of the other racialized groups combined.
5.9 This group of mixed race has been created by the DSBN and Warren Hoshizaki to control 66% of the overall racialized census workforce. Leaving only 34% for the remaining 7 other racialized groups.
5.10 According to the statistics, DSBN and Warren Hoshizaki must believe that this particular group—individuals of mixed race must be more intelligent and productive than all other racialized groups combined because they outnumber them all by 2 to 1.
5.11 Why are there almost twice as many mixed race employees working for the DSBN than there are across the remaining 7 racialized groups all put together is a very intriguing topic that the DSBN and Warren Hoshizaki should have to answer for?
5.12 What is it that the DSBN and Warren Hoshizaki are infatuation with selectively recruiting mixed race individuals over non-mixed races?
5.13 The DSBN and Warren Hoshizaki have significantly benefited by having this mixed races group. As the mic race group makes up a laughable 66% of the DSBN overall racialized census workforce in 2020. Without this mixed race racialized group, the DSBN census workforce average would and awful and pitiful 4.1%.
5.14 What the Turner Consulting Group said on white staffing practices is crystal clear and happens at the DSBN. “In organizations without formal mentoring programs, it is typical for leaders to mentor those who look like them and have similar backgrounds.”
5.15 Or in other words and reading between the lines “In organizations (like the DSBN) without formal mentoring programs, it is typical for leaders (like Warren Hoshizaki) to mentor those who look like them and have similar backgrounds.”
5.16 Let’s recall that the racialized population of the Niagara Region was 9% in 2016, which means that there is a disparity of 4.9% between the 2020 racialized workforce and the racialized population of the Niagara Region in 2016.
5.17 Even with the DSBN and Warren Hoshizaki attempting to manipulate the data by using six year old and outdated population statistics with the 2020 racialized workforce, that were purposely posted in smaller communities to increase their percent presence.
5.18 The DSBN and Warren Hoshizaki were still unable to even come close to matching their own staff to the actual real world racialized population of St. Catharines, which is estimated by Statistics Canada to be roughly 15.3%.