DSBN Organizational Whiteness Shifting
4.1 Let’s examine the breakdown of the DSBN and Warren Hoshizaki’s Organizational Whiteness workforce on a bigger scale.
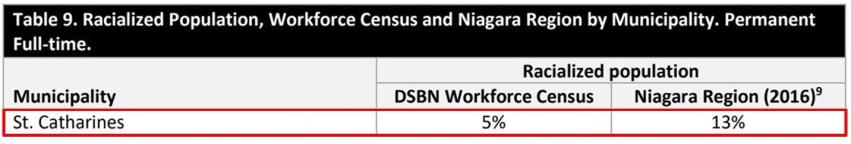
4.2 Keep in mind this crucial truth. The DSBN Workforce Census was conducted in 2020, whereas the Racialized Population in the Niagara Area statistics being used to compare to are from 2016.
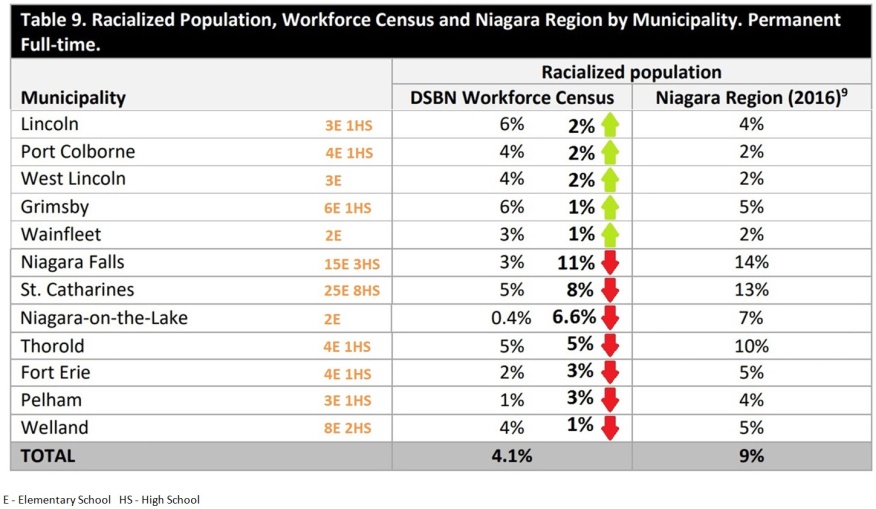
4.3 When comparing the DSBN and Warren Hoshizaki’s (2020) DSBN racialized workforce to the (2016) racialized population in the first 5 municipalities of Table 9. It reveals an average increase of 1.6% (2020) more racialized indiduals within the DSBN workforce over the (2016) racialized population. (Lincoin, Port Colborne, West Lincoin, Grimsby and Wainfleet)
4.4 Examining Table 9, you can also observe that the DSBN and Warren Hoshizaki experienced a huge reduction in their (2020) racialized workforce over the (2016) racialized population over the bottom 7 municipalities of an average of 5.37%. (Niagara Falls, St. Catharines, Niagara-on0the-Lake,Thorold, Fort Erie, Pelham and Welland)
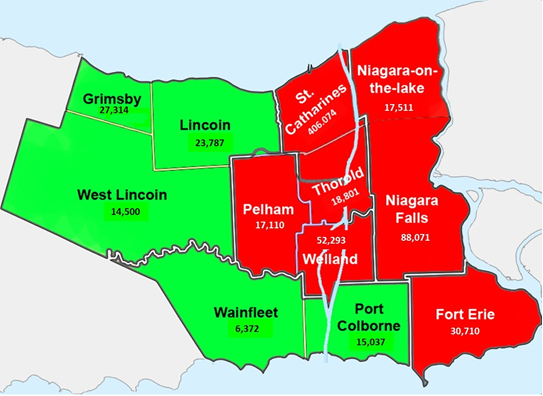
4.5 The average general population for the 5 top Niagara Regions that had a (2020) DSBN workforce that was more racially diverse then the (2016) racialized population is 18,056 individuals.
4.6 The average general population of the bottom 7 Niagara regions that had a (2020) workforce that was less racially diverse then the (2016) racialized population is 54,472 individuals.
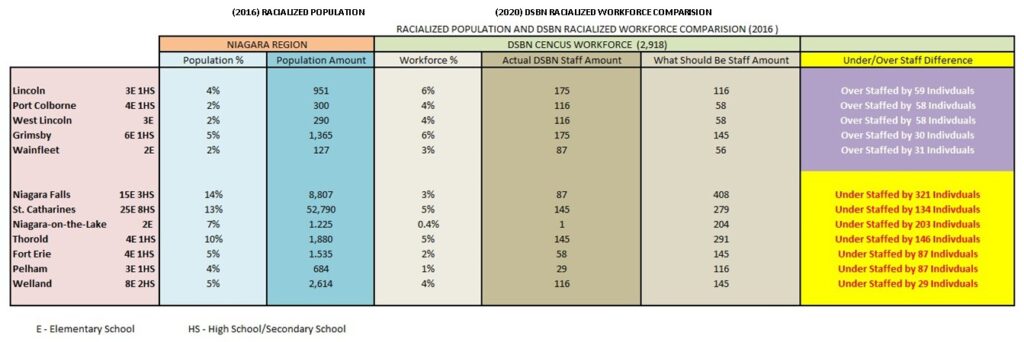
4.7 So what we can see is that the larger municipalities with there is a higher concentrations of racialized populations, there are obviously negative inequalities in the lower sizes of the DSBN racialized workforce presence. Why is that?
4.8 One would have to surmise that the DSBN and Warren Hoshizaki purposely deployed their racialized employees to these little cities/township in order to maximize their return on investment.
4.9 For instance, if a DSBN school requires 20 DSBN staff members and 5 are racialized employees. These 5 racialized employees make up 25% of the entire staff. If the same 5 racialized employees were placed in a school that required 50 DSBN staff members. These same employees would now only account for 10% of the total number of racialized employees at the school.
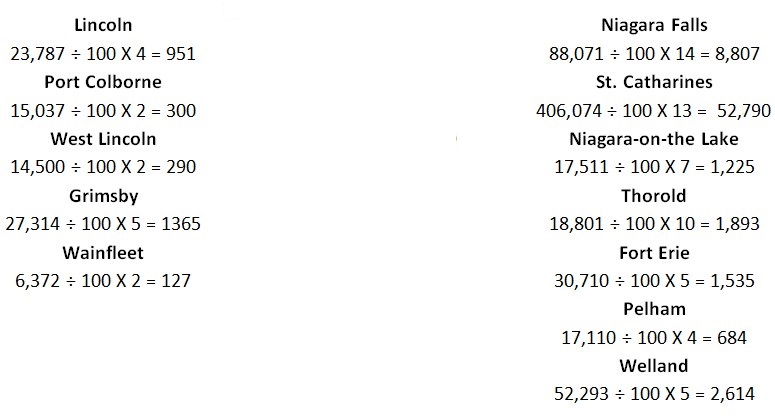
City 2016 Population ÷ 100 X The Racialized Population % = Final Answer
4.10 Let’s not forget that the DSBN workforce was far less racially diverse in 2016 than it was in 2020. Hence why the DSBN and Warren Hoshizaki choose to use the 2020 DSBN workforce numbers and not 2016.
4.11 The DSBN and Warren Hoshizaki are experienced players in the game of Minority Shifting and they know how and where to exactly place their racialized employees to increase their overall racialized workforce to produce the best results.
4.12 There is ABSOLUTELY NO LOGICAL explanation other than the DSBN and Warren Hoshizaki are using this kind of discriminatory, oppressive, and racist recruiting practices for there to be such large gaps in the DSBN racialized workforce.
4.13 After reading the Turner Consulting Group audit, there can be no doubt in anyone’s mind that there were more than enough racialized individuals, who were more than qualified to fill all these gaps within the DSBN. But the DSBN and Warren Hoshizaki were uninterested in doing that and continued to acquire more Caucasian workers, rejecting the notion that they should be hiring more racialized individuals to equal reflect the Niagara Region.
4.14 The use of the 2016 racialized population for each municipality seems to be convenient and deliberate way to try and circumvent the real story at hand. It appears that the DSBN and Warren Hoshizaki use these older stats in an attempt to marginalize the truth of the situation into today’s real world.
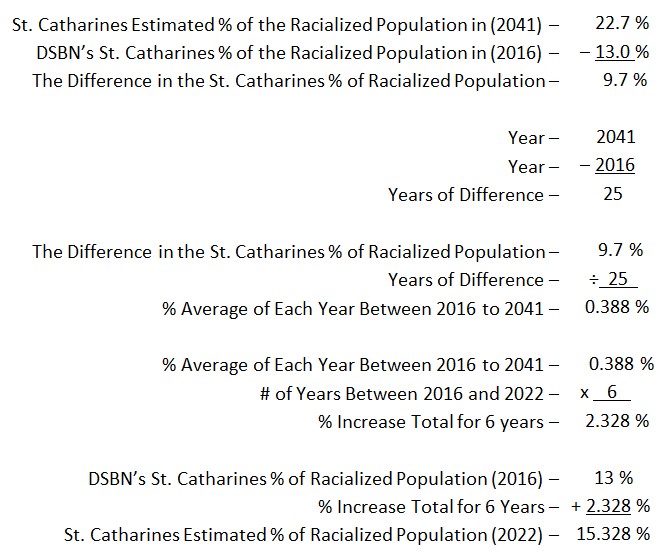
4.15 Statistics Canada estimates that the Proportion of the racialized population could respectively increase to 22.7% by 2041 in St. Catharines – Niagara.
4.16 This means an average racialized population growth of .388% per year since 2016. So based on the DSBN and their 2016 racialized population number of 13% and the annual growth of the racialized population of .388% since 2016. It is safe to assume that rather than underestimated 13% for St. Catharines racialized population, it should be closer to 15.3% in 2022.
4.17 In fact these numbers may also be underestimated as the DSBN Audit Action Plan states “Statistics Canada data also shows that the Niagara Region’s racialized population is growing at a faster rate than the total provincial population. As such, this gap in representation could continue to grow if a deliberate focus is not placed on diversifying the teacher workforce, particularly in the larger municipalities, which are becoming increasingly diverse.”
4.18 In order to avoid appearing worse than they already do, it appears that the DSBN and Warren Hoshizaki tried to manipulate the racialized population estimates by using outdated demographic statistics.